Data & Analytics Dashboard
Track your digital marketing performance with comprehensive analytics and real-time reporting. Monitor key metrics, analyze trends, and make data-driven decisions to optimize your campaigns.
Website Traffic
127,543
↗
+12.5% from last month
Conversion Rate
4.8%
↗
+0.8% from last month
Revenue
$89,230
↗
+18.2% from last month
Avg. Session
3:42
↘
-2.1% from last month
Traffic Analytics
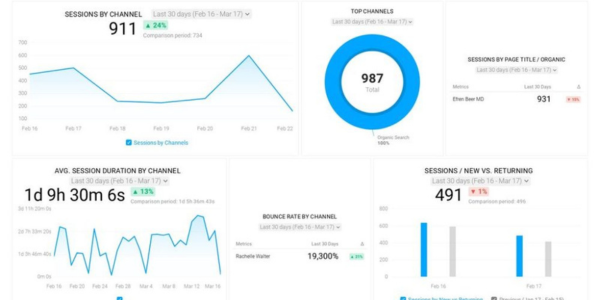
Monitor your website traffic patterns, peak hours, and user engagement metrics across different channels and time periods.
Conversion Funnel

Track user journey from awareness to conversion, identifying bottlenecks and optimization opportunities in your sales funnel.
Campaign Performance
| Campaign | Impressions | Clicks | CTR | Conversions | ROI |
|---|---|---|---|---|---|
| Google Ads - Search | 245,832 | 12,041 | 4.9% | 582 | +340% |
| Facebook Campaign | 189,543 | 8,923 | 4.7% | 421 | +285% |
| LinkedIn Ads | 67,291 | 2,184 | 3.2% | 156 | +145% |
| Email Marketing | 42,156 | 3,847 | 9.1% | 728 | +512% |
Top Performing Pages
/product-landing
23,421 views
/pricing
18,294 views
/about-us
12,856 views
Traffic Sources
Organic Search
42.3%
Direct Traffic
28.7%
Social Media
19.1%
Paid Ads
9.9%
Device Breakdown
Desktop
54.2%
Mobile
38.1%
Tablet
7.7%
Monthly Performance Summary
This month shows exceptional growth across all key metrics. Website traffic increased by 12.5%, while conversion rates improved by 0.8 percentage points. Revenue growth of 18.2% demonstrates the effectiveness of our optimized campaigns.
Conversion rate optimization delivering results
Paid advertising campaigns performing above benchmark
Email marketing showing highest ROI at 512%